亲爱的FRM学员:欢迎来到融跃教育FRM网!
距离2026年5月9日FRM一级考期还有 天!
 全国热线:400-963-0708
  网站地图
网站地图
A money management firm has USD 33 billion in assets. The risk manager computes the daily VaR at various confidence levels as follows:
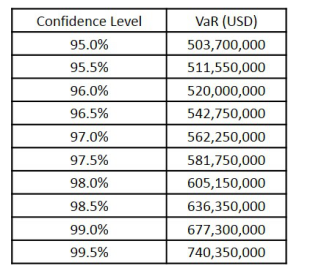
What is the closest estimate of the daily expected shortfall at the 96.5% confidence level?
AUSD 543 million
BUSD 588 million
CUSD 634 million
DUSD 740 million
打开微信扫一扫
添加FRM讲师
课程咨询热线
400-963-0708
微信扫一扫

还没有找到合适的FRM课程?赶快联系学管老师,让老师马上联系您! 试听FRM培训课程 ,高通过省时省心!

 行业动态
行业动态 职业发展
职业发展 融跃动态
融跃动态 FRM协会动态
 FRM最新公告


